- 26/04/2025
- MyFinanceGyan
- 19 Views
- 0 Likes
- Share Market
Mastering the Share Market: Powerful Candlestick Patterns – PART I
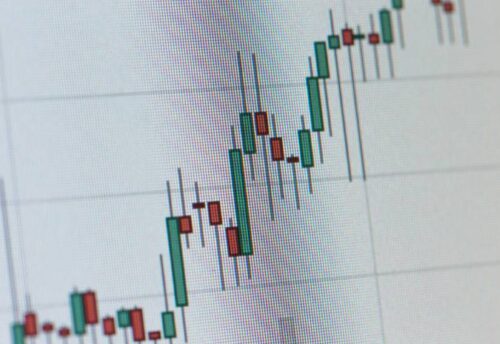
In the share market, price movements often seem chaotic. But if you look closely, the market talks through patterns—especially candlestick patterns. These patterns are not just colorful bars on a chart; they’re powerful signals that reveal the psychology of buyers and sellers. Whether you’re a beginner or a seasoned trader, understanding candlestick patterns can significantly improve your decision-making. In this blog, we’ll dive deep into the most important types of candlestick patterns with chart examples, helping you make smarter trades in the share market.
What is a Candlestick Pattern?
A candlestick pattern is a formation on a candlestick chart that gives insights into market sentiment. Each candlestick shows the open, high, low, and close prices of a stock within a specific time frame. When these candles group together in a certain way, they form patterns—signals that suggest whether the price may go up (bullish), down (bearish), or remain indecisive.
Why Are Candlestick Patterns Important in the Share Market?
- Quick signals for buying or selling opportunities
- Help identify trend reversals or trend continuations
- Useful for short-term traders and even long-term investors
- Provide a visual advantage over bar or line charts
Types of Candlestick Patterns in the Share Market:
Let look at famous Single Candlestick Patterns:
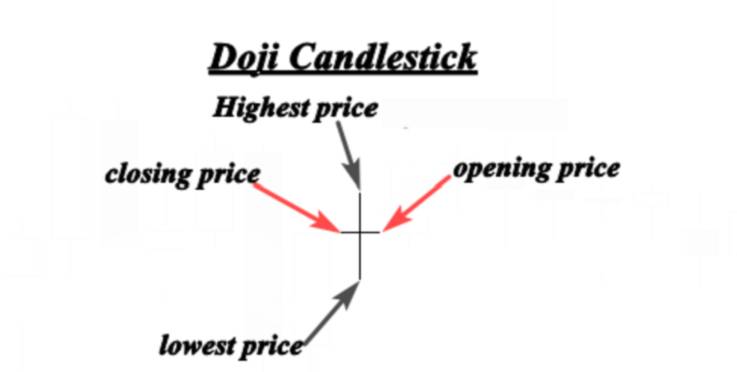
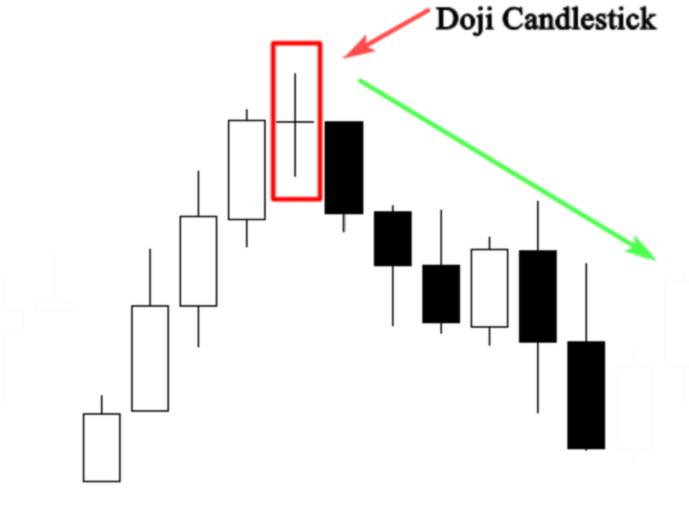
Doji:
- Meaning: Doji is one of the most important Japanese candlestick patterns, when this candlestick forms, it tells us that the market opens and closes at the same price which means that there is equality and indecision between buyers and sellers, there is no one in control of the market.
- Chart Appearance: The open and close prices are almost the same
- Implication: Possible trend reversal, especially when seen after a strong trend
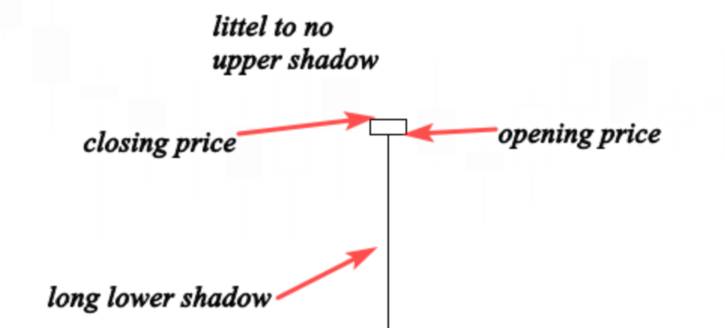
Hammer:
- Meaning: The Hammer candlestick is created when the open high and close are roughly the same price; it is also characterized by a long lower shadow that indicates a bullish rejection from buyers and their intention to push the market higher.
- The hammer is a reversal candlestick pattern when it occurs at the bottom of a downtrend. This candle forms when sellers push the market lower after the open, but they get rejected by buyers so the market closes higher than thelowest price.
- Chart Appearance: Small body with a long lower wick
- Implication: Buyers are stepping in after initial selling
Example: A hammer after a downtrend suggests a potential reversal to the upside.
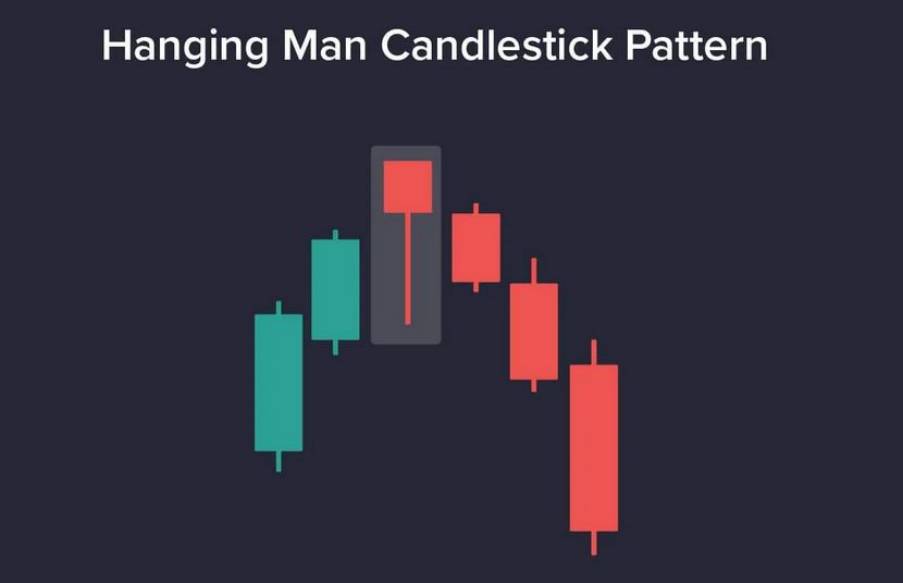
Hanging Man:
- Meaning: Bearish reversal
- Chart Appearance: Similar to the hammer but appears after an uptrend
- Implication: Selling pressure is building up
Example: In an uptrend, a hanging man can signal a bearish reversal if confirmed by the next candle.
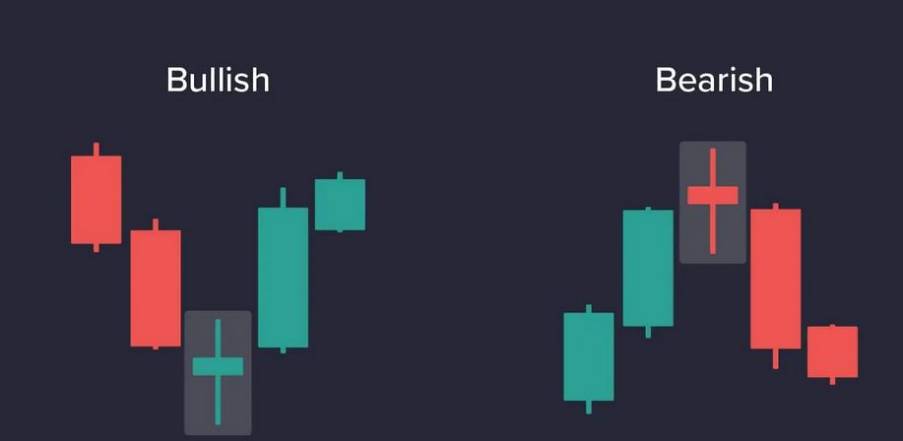
Spinning Top:
- Meaning:Its structure offers a glimpse into the market’s indecision, providing traders with potential trading opportunities across various periods.
- Chart Appearance:Small body with long upper and lower shadows
- Implication:Neither bulls nor bears are in control
A Spinning Top candlestick is characterized by its small body and long upper and lower shadows. The small body represents a close price that’s very close to the open price, signaling indecision between the buyers and the sellers. The long shadows, on the other hand, indicate that both bulls and bears were active during the period, but neither could secure a victory.
- Small Body: The body of the candle (the difference between the open and close prices) is small, representing indecision.
- Long Shadows: Both the upper and lower shadows (the lines extending from the body representing the range between the high and low prices) are long, showing a wide range of price action during the period.
- Color Irrelevant: The color of the candle, whether bullish (typically white or green) or bearish (typically black or red), doesn’t necessarily impact its interpretation.
Use Case: Good for identifying possible pauses or consolidation in the trend.
Disclaimer: This article is meant to create awareness and for educational purposes only. It does not give legal or financial advice or recommend any product.