Mastering the Share Market: Powerful Candlestick Patterns – PART II
In this section, we’ll explore multiple candlestick patterns—a powerful part of technical analysis that involves two or more candlesticks forming specific shapes on a price chart. These patterns are more reliable than single candlestick patterns because they consider how candles relate to each other, giving stronger signals about where the market might move next.
Unlike single patterns (like the Doji or Hammer), multiple candlestick patterns are all about the story told by consecutive candles. They help traders spot potential reversals or continuation of trends with greater confidence.
Common Multiple Candlestick Patterns are
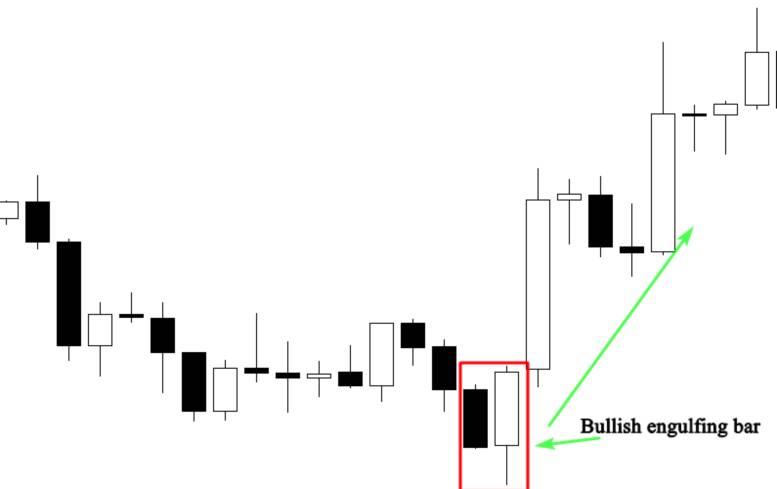
Bullish Engulfing:
Meaning: The engulfing bar pattern is one of the most powerful and profitable price action patterns, knowing how to use it properly as an entry signal will tremendously improve your trading profitability.
Formation: A small red candle followed by a big green candle that completely engulfs it
Implication: Buyers are taking control
Example: Appears after a downtrend, suggesting a possible move upward.
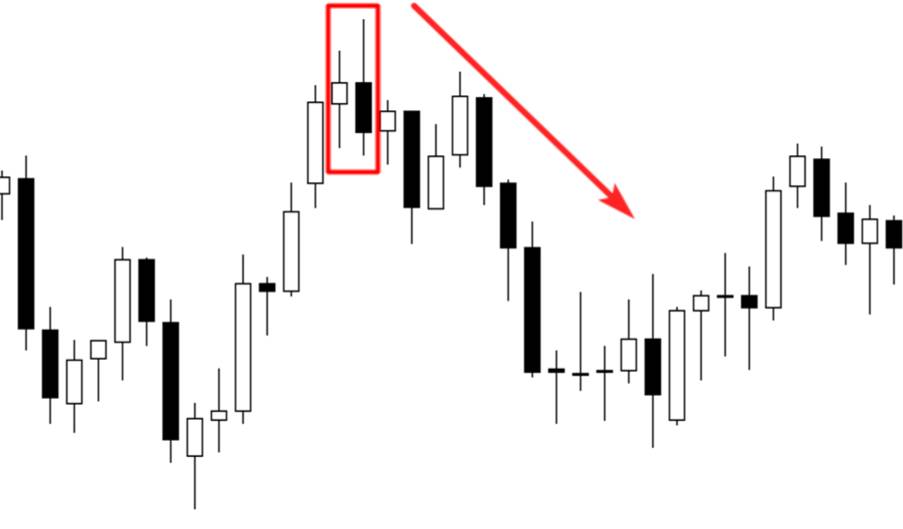
Bearish Engulfing:
Meaning: Strong bearish reversal. The first body is smaller than the second one, in other words, the second body engulfs the previous one When this pattern occurs at the end of an uptrend, this indicates that buyers are engulfed by sellers which signals a trend reversal.
Formation: A small green/white candle followed by a large red/black candle
Implication: Selling pressure is increasing
Example: Appears after an uptrend, showing sellers are taking over.
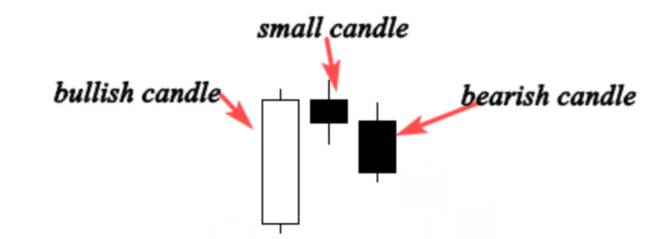
Morning Star:
Meaning: Bullish reversal. It often occurs at the bottom of a downtrend. The morning star pattern shows us how buyers took control of the market from sellers, when this pattern occurs at the bottom of downtrend near a support level, it is interpreted as a powerful trend reversal signal.
Formation: Three candles – red/black (down), a small indecisive candle (Doji/spinning top), and a strong green/white candle
Implication: Downtrend is losing strength, uptrend may start
Example: Great signal when seen near a support zone.
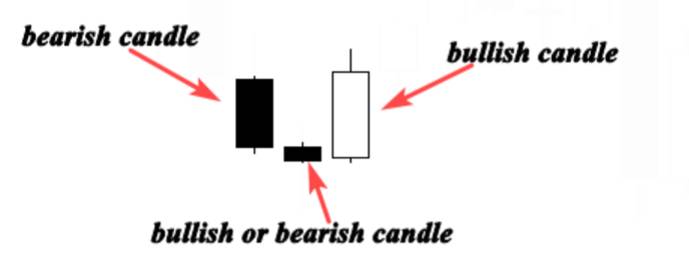
Evening Star:
Meaning: Bearish reversal. It usually occurs at the top of an uptrend. the evening star pattern is the bearish version of the morning star pattern
Formation: Green candle, small candle, then a large red candle
Implication: Uptrend could be ending
Example: Appears at the top of a trend, useful for exit signals.
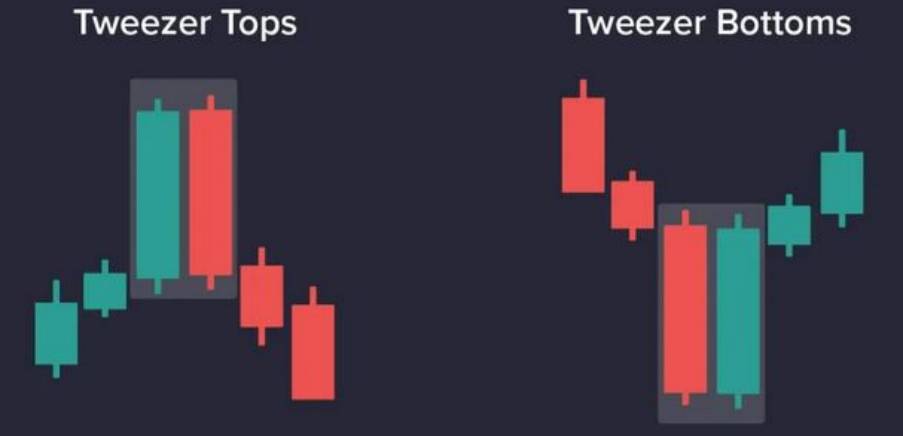
Tweezer Tops and Bottoms:
Tweezer Top: Two candles with similar highs – bearish reversal
Tweezer Bottom: Two candles with similar lows – bullish reversal
Tweezer Tops and Bottoms are revered candlestick patterns that help traders discern potential price reversals in the market.
Use Case: Helps identify double-top or double-bottom formations in the share market.
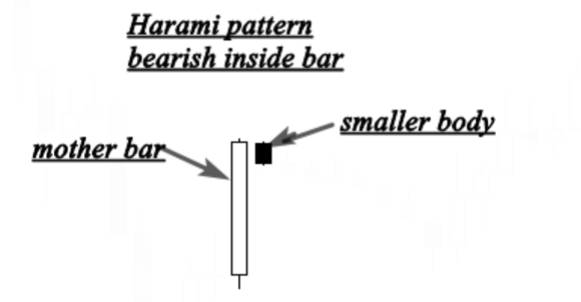
Harami Pattern:
Meaning- The Harami is a two-candlestick pattern often observed in a trending market. The Harami Cross is a variant of the Harami pattern where the second candlestick is a Doji (a candlestick where the open and close prices are virtually the same), signaling market indecision.
Bullish Harami: Big red candle followed by a small green candle
Bearish Harami: Big green candle followed by a small red candle
Implication: Reversal or pause in trend
Use With: RSI or volume for better confirmation.
Disclaimer: This article is meant to create awareness and for educational purposes only. It does not give legal or financial advice or recommend any product.